

Source: Universities UK (2011) Driving Economic Growth, London: Universities UK, 1 December; also see Chester, J., and Luzajic, J. (2011) ‘Time to recognise that universities have a central role in UK growth strategy,’ The Guardian, 1 December.
Source: Universities UK (2011) Driving Economic Growth, London: Universities UK, 1 December; also see Chester, J., and Luzajic, J. (2011) ‘Time to recognise that universities have a central role in UK growth strategy,’ The Guardian, 1 December.
 Amidst a discursive struggle this week over the state of finances for higher education and research in the UK, which reached a crescendo two days ago (e.g., see ‘Universities face meltdown – and all of Britain will suffer‘; ‘Higher education will be ‘on its knees’ after cuts‘), I could not help but note what Prime Minister Gordon Brown had to say in a speech (‘Education as a global growth industry‘) on 14 January:
Today, I also set out our commitment that, working in partnership with you, and our schools, colleges and universities, we will support a major expansion of their activities across the world. Central to this is a new ambition, which I am setting today for Britain, that we double the value of our higher-education exports.
We will do this in four ways. We will welcome students here to Britain on the basis of merit and ability – of course with all the proper checks in place. We are determined to stamp out abuse of student visas and I announced last year we will shortly bring forth proposals on this. I emphasise that all students that come here legitimately, to benefit from our UK education system, will be made welcome, because we are not prepared to put legitimate language courses, and schools and colleges out of business or set back our efforts to expand our educational trade.
Secondly, we want to reinforce and build on the international standing of our qualifications, by offering examinations and qualifications that are rightly highly regarded around the world.
Thirdly, we will work to develop partnerships between UK institutions and universities in many different countries around the globe. Already over the last four years, we have promoted thousands of new partnerships across all sectors, from schools linking to post graduate research through our initiatives for international education. In a global knowledge economy, we know we will thrive, not just by developing our own knowledge, but by taking knowledge and sharing it with the billions of people who understand that education is the key to survival and success.
Fourthly, we will use distance learning to build on the work of our excellent universities that are already making use of great and rapid advances in the relevant technology. As I said, in our higher-education strategy, we welcome and support the work of the group chaired by Lynne Brindley. This task force is looking at how we can expand and develop the use of IT and online learning, not only in the UK, but across the world. Across higher education, we will want to ensure that we maintain and enhance world-class standards in everything we do in our international activities.
This is not about chasing money; it’s about leveraging our higher education system to offer the highest-quality opportunities across the world.[my emphasis]
This argument was matched, on the same day, by Peter Mandelson (the UK’s Universities Secretary) who suggested in The Guardian (‘Our universities are not under threat. Their income is at record levels‘) that:
The Russell Group can take much credit for the world-class standard of British higher education today. But the government inherited a badly underfunded university sector in 1997, which a former Conservative education minister described as “poorer pay, degraded facilities, less money to support the teaching of each student”. This government’s agenda for universities has included more state funding than ever before – an increase of over 25% since 1997. It is against this backdrop that British universities have developed into some of the very best in the world and are a critical part of our knowledge economy.
But this wasn’t simply on the back of state funding. In fact, while government spends £12.3bn on higher education today, total university income from all sources was over £23bn in 2007-2008. Government incentives have pushed universities to seek new forms of income from donations, international students and commercial engagement with industry. These are consistently rising. The decision to introduce tuition fees in England has also provided a new source of income. [my emphasis]
Mandelson carries on to note:
It is for universities themselves to identify where savings should be found, and they are as free as ever to focus on their research excellence and institutional strengths. The search for greater efficiencies should include more part-time courses and a greater range of one- or two-year degrees.
As I discussed earlier in GlobalHigherEd (‘Learning from London‘) the export earnings logic is already putting pressure on some UK higher education institutions, such that they are being driven the create new postgraduate [graduate degree] programs that have hundreds of Masters students supported by a small coterie of faculty. And I subsequently heard, in response to my ‘Learning from London‘ entry, that some London-based Masters programs have faculty sign contracts with students denoting exactly how many hours of “contact time” students can expect (it was a shockingly small number of hours per degree…something like 5 hours for the entire MA, assuming they follow through with the promised hours).
Now, as we also noted in ‘Taking note of export earnings‘, this global growth industry agenda is underlain by an ideological shift:
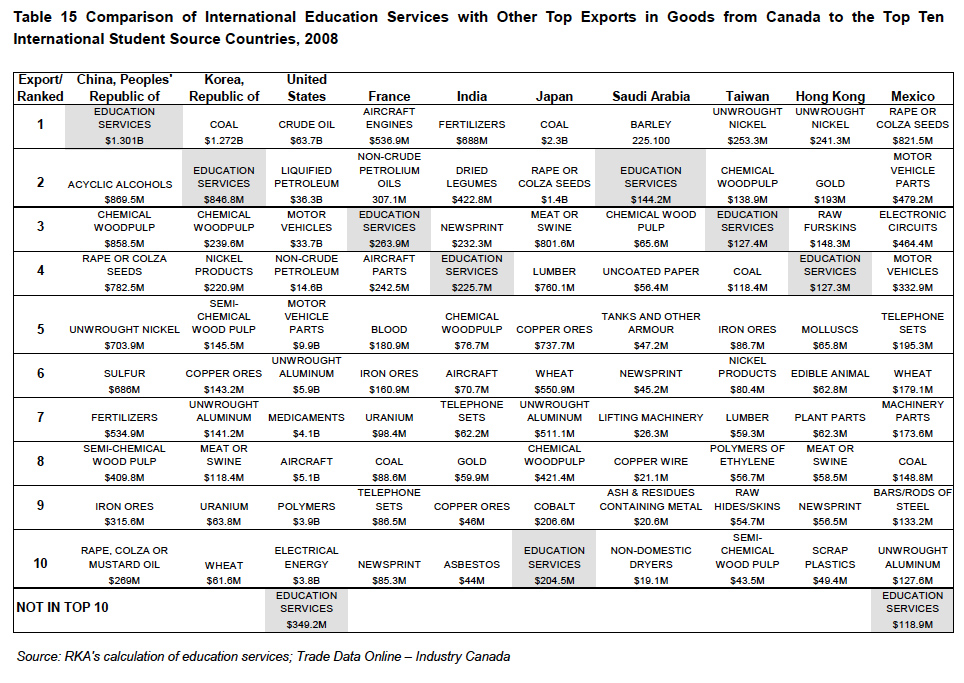
We would argue that these numbers are being constituted, and debated about, in the context of an ideological transition – one that increasingly enables views to emerge of higher education as a driver of economic versus cultural-political change. For example, a decade or two ago, it would have been impossible to imagine creating tables such as the one profiled in Kate Geddie’s entry in GlobalHigherEd in which education is measured against ‘scrap plastics’ or ‘chemical woodpulp’. Thus, a new organising logic, to use Saskia Sassen’s phrase, is emerging: one that reframes higher education as an urban/national/global services industry, for good and for bad.
Assuming we are right (of course we might not be!), it is interesting to think about how effective a state-enabled fiscal crisis for higher education institutions (in the range of a 12.5% cut so far, then 6.3% in succeeding years over three years “taking the total to about 30%”) will be in propelling this export agenda along. To be sure there is a broader fiscal crisis in UK public finances, but can it really be ameliorated on the backs of UK universities (and students, local and foreign)? All savings via higher ed cutbacks are significant, but in the big picture they are not that significant for the overall UK budget. But the transformation of the values shaping higher education policy, including enhanced state control versus greater autonomy for HEIs, is much more significant, more noteworthy, and certainly worth deliberating about. And the function of the crisis – a “politically mediated moment of decisive intervention and structural transformation” to use Colin Hay’s words* – is also worth unpacking.
In the end, is a UK funding crisis an effective mechanism to spur on a quality-oriented ‘education as a global growth industry’ development agenda? Will it provide a defacto or by design opening for private sector providers into the UK ‘market’, as it is doing now in the US (e.g., see Changing Higher Education‘s ‘For-profit higher education moves to fill gaps left by state budget shortfalls‘)? And who gains and who loses in the process? For example, can those 16-17 faculty and 13 teaching fellows (3 with PhD) I profiled in ‘Learning from London‘ take on even more that the “almost 400” masters students they already have to cope with, support, mentor, and educate? Something has to give, doesn’t it?
Kris Olds
* Hay, Colin (1999) ‘Crisis and the structural transformation of the state: interrogating the process of change’, British Journal of Politics and International Relations, 1(3): 317-344.
I sometimes wonder if it is worth drawing lines and generating comparisons between two seemingly disparate processes that are at work at different scales, and in different countries, but why not – I’m jetlagged with some late night time to spare.
 First, the US Council of Graduate Schools (CGS) released a new report (Findings from the 2009 CGS International Graduate Admissions Survey, Phase III: Final Offers of Admissions and Enrollment), and associated press release, that flags the challenges the US has in attracting foreign students at the levels it once did. The full report (from which Figure 1 to the right is taken) is definitely worth reading. This segment of the final paragraph particularly caught my eye:
Despite the high quality of graduate education in the United States, we cannot continue to assume that our institutions are the number one destination of international graduate students. In the last three years, growth in the numbers of international graduate students coming to the United States has slowed, and now the numbers have flat lined, even though global student mobility has rapidly increased over the last decade. Given this new reality, policymakers and the graduate school community are faced with several key questions if the United States is to remain the destination of choice for international graduate students: Are there national policies that deter international students from coming to the United States for graduate school? How do we make U.S. graduate programs attractive to both domestic and international students? Within the constraints of the current economic situation, what can institutions do to more effectively attract international students to their graduate programs? And, what lessons can we learn from the successes of colleges and universities in other countries in attracting international students to their graduate programs?
Meanwhile, I was reading the Guardian‘s Tuesday education insert today, and one faculty vacancy advertisement also caught my eye: University College London (UCL) “wishes to appoint an International Relations Lecturer to contribute to research and teaching on the MSc in International Public Policy within the Department of Political Science/School of Public Policy“. Given my interest in international/global public policy, I read through the advertisement to see what the new hire would have to teach, and came across an interesting number:
UCL is a multi-faculty college of the University of London with a population of over 17,000 students from more than 130 different countries. It is ranked by the Times Higher as one of the top five universities worldwide. Founded in 2005, the Department of Political Science has quickly established itself as a leading international centre for political research and came 6th in the UK in the 2008 Research Assessment Exercise (RAE) organised by the British Higher Education Funding Councils – 3rd in terms of the percentage of research deemed to be ‘world leading’ (20%) and ‘internationally excellent’ (45%). It is the only department in the UK centred on graduate teaching and research, and currently has almost 400 Masters students on its programmes.
Nearly 400 (and rising) Masters students from around the world, in a new graduate student only department. Thus, across the Atlantic, albeit at two vastly different scales, we see flat-lining if not decline (in the US) versus rapid expansion (in UCL, London, UK). Of course this is but one department’s experience, though I have seen broader signs that the UK has seen significant growth in graduate programmes, including at the Masters level.
 Now, if you really wanted to unpack the developmental dynamic further, you would have to explore issues like the context (London, a global city which is also situated within the European Higher Education Area), the national system (which incentivizes departments to create one year taught Masters programs), an emerging sense that higher education is an export industry in the UK, and so on. But let’s also burrow down to the level of academic practice, as captured in this advertisement, and ask this question: how do faculty members in UK universities like UCL or Oxford or King’s College London balance the need to generate revenue via taught Masters programmes, with the imperative to conduct ever more innovative research (which ideally needs to generate ‘societal impact’ as well), all the while supporting increasingly large numbers of graduate students?
And where do they put them?! By my count this particular department has 16 faculty (17 with this hire), 13 teaching fellows (3 with PhD) and “almost 400” masters students. This equals 25 MA/MSc students per faculty member, or 21 per PhD holder.
I know the quality of higher education is high in the UK, and is likely excellent in this particular department, but are these numbers and proportions (students/faculty) typical at the UK level, manageable for faculty, and reflective of the attractiveness of one year Masters programs (which are not at all common in the US)?
Moreover, are learning outcomes of such programs on par across national boundaries (e.g., the UK versus the US or the Netherlands), and do PhD applicants (e.g., from the US to the UK, or from the UK to the US) come to their PhD programs from the MA/MSc with equitable levels of knowledge and capabilities, all things equal?
If so, then places like the UK (and UCL) are doing something right, and the US can perhaps learn from the UK experience.
If not, however, then it might be time to ask other questions about the nature and implications (especially with respect to quality) of the rapid growth of Masters degrees in London, and the UK more generally.
Can we learn from London, and if so what?
Kris Olds
 Editor’s note: this guest entry was kindly prepared by Jason Baumgartner (pictured to the right) of Indiana University in the United States. Jason has worked for the Office of International Services at Indiana University since 1999. He is the lead software developer of the iOffice application suite, which is a comprehensive immigration case management solution to enable staff to proactively assist international students and scholars in maintaining their lawful stay without interruption. This software is utilized by international offices throughout the Indiana University system and is licensed to other universities throughout the country. He is a member of NAFSA. He developed the current algorithm and conducts the annual analysis (since 2000) for the NAFSA Economic Impact of International Students. He has a Master’s in Information Science from Indiana University.
As regular readers of GlobalHigherEd will notice, this is another in a series of entries (see ’Measuring the economic impact of ‘export education’: insights from New Zealand‘; Making sense of the economic contribution of international students in Australia (up to 2008)) that attempt to shed light on how countries calculate the economic impact (and ‘export earnings’) of foreign students. I encourage you to read Jason Baumgartner’s entry below for its own sake, but also to begin comparing how the US (and this is really as close to an official view as one could get in the complex US higher education landscape) frames this issue in comparison to other countries, including New Zealand and Australia.
As I’ve noted before, we welcome guest entries on this issue from people studying the issue in any country, be they government officials, academics, consultants, or graduate students. The issue of understanding the economic impact of foreign students is severely underdeveloped, with little reflection on how different analytical models (and associated assumptions) can generate very different findings. Our thanks to Jason Baumgartner for his help in moving thinking about this issue forward. Kris Olds
~~~~~~~~~~~~~~~~~~~~
NAFSA’s annual economic impact statements estimates the amount of money international students bring to the United States to support their education and stay. For the 2007-2008 academic year it is estimated that international students contributed approximately $15.54 billion to the U.S. economy. The following graph outlines the growth of this economic impact over the last 30 years:

The economic impact is defined as the amount of money that international students collectively bring into the United States to pay for their education and to support themselves while they (and in some cases, their families) are here.
The methodology used to calculate the economic impact has been greatly refined over that last three decades with the current model in place since 2000. The current algorithm in use was developed by Jason Baumgartner and Lynn Schoch at Indiana University – Bloomington’s Office of International Services. The analysis of the dataset has been conducted each year since 2000 by Jason Baumgartner.
The goal of this economic impact formula is to use data already collected for other purposes to provide a reasonable estimate of the economic resources that international students import to the United States to support their education here each year. The following figure outlines the algorithm:

The data sets used for this analysis comes from the following two sources:
The extensive data provided by these two sources (which collect it directly from surveys of the institutions involved) allow us to make our estimates sensitive to differences between institutions. However, there are still areas where our estimates and formulas could be improved. For example, we compute economic impact only for students reported in Open Doors. Universities that do not provide information to the Institute of International Education are not represented. Also, enrollment reports represent peak enrollment, and not necessarily enrollment levels throughout the year.
To estimate expenses we use tuition, fees, and living expenses estimates derived from Peterson’s data collected on surveys completed by institutions every year. We try to make our calculations sensitive not only to differing costs at institutions, but differing costs for ESL students, undergraduates, graduate students, and students on practical training as follows:
Economic impact of an international student equals tuition and fees, plus room and board, plus miscellaneous figured at 50 percent of room and board, less U.S. support. We assume that spring enrollment figures are the same as the fall figures reported, that all students are enrolled full time for two semesters or three quarters a year, and that students live on campus for the full year. The miscellaneous expenses, enumerated in Peterson’s data, average about 40 percent of room and board expenses. We use a 50 percent figure as an approximation that includes all extra expenses except for travel.
The amount of U.S. support given to international students is calculated to subtract from the expenses in order to establish a greater sense of the export dollars flowing into the U.S. economy. For this analysis the Open Doors survey is used; which asks schools to report the percentage of their students who are self-funded, the percentage who have U.S. source income, etc. The U.S. support percentage includes funding from a U.S. college or university, the U.S. Government, a U.S. private sponsor or current employment. For this analysis the percentages are calculated based upon the institution’s Carnegie classification and the academic career of the student. For example, this process will differentiate the level of support between undergraduates and graduates at a particular research institution while it also differentiates between a baccalaureate classified institution from an associate’s classified institution.
This model represents the export dollars brought in to each institution, state, and the overall U.S. economy that can be tracked over time. This provides a good measure for comparisons to other export data, such as data published by the Department of Commerce. This estimate also takes into account any U.S. funding or employment the international students may be receiving in an effort to best represent these export dollars flowing into the U.S. economy. This provides for an algorithm that identifies and estimates for this large U.S. export, provides a political argument for support of international education at both the national and university level, provides a trend of this data going back many years, and is very sound to hold up to the political nature of critiques of this statistical analysis.
There is no multiplier effect calculated within this analysis which may provide an even greater representation of the end result of these export dollars in terms of the additional revenue generated by the flow of these dollars throughout the overall U.S. economy. Instead this model focuses on core export dollars as a result of international students studying within the United States.
For more information please refer to the NAFSA Data & Statistics.
Jason Baumgartner
Editor’s update: link here for the press release of the newest US report (‘International Students Contribute $17.6 Billion to U.S. Economy‘) which was released by NAFSA on 16 November 2009. The report was also produced by Jason Baumgartner.
 The latest contribution to assessing the “economic contribution” of international students to Australia’s economy was released last week. The informative report, titled The Australian Education Sector and the Economic Contribution of International Students, was prepared by Access Economics on behalf of the Australian Council for Private Education and Training (ACPET).
The executive summary of the 35 page report notes, amongst other things, that:
I’ll paste in a sample of tables and graphs from the report below:


Please keep in mind, as noted in our 24 June 2008 entry ‘Analysing Australia’s global higher ed export industry‘, that higher (tertiary) education is one of several contributing ‘education’ activities to producing export earnings:
The development of capacity to assess the economic impact of foreign students is part and parcel of the denationalization and commercialization process. Capacity to analyze and hence constitute this new services sector – a fast growing ‘industry’ in the views of many stakeholders – is strikingly variable. In my view Australia and New Zealand have gone the furthest down this path, and it is therefore worth understanding how the Australasians approach this issue from an analytical (economic impact assessment) perspective.
It is also important to understand which institutions are emerging as key knowledge brokers regarding the economic contribution of international students. As the New Zealand (see ‘Measuring the economic impact of ‘export education’: insights from New Zealand‘) and Australian cases suggest, private consulting firms made up of economists (some of whom used to work for federal/national governments) are key actors. There is, thus, a symbiotic relationship between the state and the private sector when it comes to analyzing the evolving nature of the services sector of the economy; one becoming increasingly associated with, in policy and analytical senses, education institutions and development agendas.
In addition, as in this case, we see an association of private sector providers contracting out to have this report developed. The ACPET is “the national industry association for independent providers of post-compulsory education and training, for Australian and international students”, including:
- Higher Education
- Vocational Education and Training
- English Language Courses
- Senior Secondary Studies
- Foundation Studies
The ACPET Mission is to:
Enhance quality, choice, innovation and diversity in Australian education and training for individual, national and global development. Work pro-actively and co-operatively with government, education and training providers, industry and community organisations, in order to ensure that vocational and higher education and training services provide choice and diversity, and well-targeted, appropriately delivered courses which are widely accessible and of high quality.
One proxy measure of ACPET’s make-up is its broad of directors, highlighting how non-university “post-compulsory education and training” actors are also becoming dependent upon foreign students in countries like Australia; a structural position that leads them to institutionalize and create an International Education Committee, which then coordinates the production of reports such as this via the expertise of Access Economics.
Given the dependency dynamic, reports such as these are both analytical devices, but also tools for lobbying. Reports such as The Australian Education Sector and the Economic Contribution of International Students are increasingly available for downloading in PDF format, which enables wide circulation via email. Traditional releases to media sources continue, as well: see, for example, ‘Learning boom amid the economic gloom‘ in The Australian.
As noted in the introduction to a recent guest entry (‘Measuring the economic impact of ‘export education’: insights from New Zealand‘), we are in the early stages of seeking a series of national viewpoints on how countries approach the export earnings issue. We would be happy to entertain proposals for guest entries on this issue, regardless of how well formed your own country’s capacity is to make sense of the data that is (and is not) available.
Kris Olds
Update: nanopolitan (‘Coal, iron ore, and education‘) makes the noteworthy point that “adjusted for population, Australia (21.7 million) hosts five times as many students as the USA (306.2 million)”. It might be worth adding that, according The Australian (‘Indian students boost the export economy‘, 2 April 2009) “Indian students now make up almost 18 per cent of Australia’s total foreign student population, the second largest group after China, which represents 23.5 per cent of the total foreign student body”.
Update 2: thanks to Brett for the links (see Comments) to two new news stories re. ‘Australian immigration launches probe on 20 colleges teaching international students for supply of fake education and work certificates necessary for the obtainment of permanent residency’.
 Editor’s note: this guest entry was kindly prepared by Dr. Adolf Stroomberge, Chief Economist, Infometrics. Dr. Stroomberge has a PhD in general equilibrium modelling and 25 years of experience in economic consulting, specialising in economic modelling, econometrics and public policy research in areas such as education, taxation, savings and retirement, energy and environment, trade and transport. He has been a member of the New Zealand Advisory Committee on Economic Statistics since 1996 and was an Expert Reviewer for the IPCC Working Group II Fourth Assessment Report released in 2007.
This is the first of a series of entries, we hope, regarding the ways in which the state, often via the contracting out process to firms like Infometrics, begins to calculate the economic impact of an emerging industry (in this case, ‘export education’). In our research we have noted substantial differences, across space, regarding the nature of the calculative process.
In countries like New Zealand, Australia, and the UK, the state has a relatively clear understanding of the economic impact of the export of education services (e.g., see ‘Graphic feed: Australia’s dependence (2007-2008) upon foreign students‘, ‘International education activity in Australia up 23 per cent from previous financial year‘, and ‘Value of educational exports to the UK economy‘). This said there are clearly debates underway about which analytical models to adopt, and about the impacts of this development approach. Other countries have made relatively little effort, or progress, in calculating such impacts. The reasons for this are many, ranging from lack of capacity, inadequate data, ideological unease with the idea of thinking about (and especially speaking about, in public at least) education as an ‘industry’, and limited inter-governmental engagement about this issue within some countries.
At the multilateral scale, this entry should be read in association with debates about the trade in education services (e.g., see the series of UNESCO/OECD forums on trade in educational services), as well as GATS (see ‘GATS BASICS: key rules and concepts‘). And from a broader perspective, it is worth thinking about the power of numbers, and the role of the calculative process in assessing, and at the same time constituting, what is undoubtedly an emerging global services industry.
Our thanks to Informetrics (especially Adolf Stroomberge) for outlining how the analytical process works in New Zealand, and to the New Zealand Mission to the European Union for insights on this topic. Readers interested in this topic are advised to see this 2008 report (‘The Economic Impact of Export Education‘) by Infometrics, NRB and Skinnerstrategic which was prepared for Education New Zealand & the New Zealand Ministry of Education. An earlier (2006) version of this report is available here.
Kris Olds
~~~~~~~~~~~~~~~~~~~
 It had been suspected for some time that the contribution of the export education industry to the New Zealand economy has seen impressive, if volatile growth, to reach around $2 billion in 2007/08. Our research in 2008 sought to establish the truth of these suspicions.
Export education is a term used to describe the foreign exchange earned from delivering education to foreign fee-paying students. In general the goods and services bought by foreign fee-paying students are consumed within the destination country – analogous to the situation with foreign tourists. In addition though, some delivery of educational services takes place in students’ own countries, such as by distance education or through educational institutions establishing a presence in foreign countries. For New Zealand, however, over 95% of the earnings of export education are earned in New Zealand.
There are two main areas of expenditure by foreign fee-paying students; tuition fees and living costs.
For New Zealand data on tuition fees is collected by the Ministry of Education from educational institutions, along with data on the number of foreign students and the courses taken. Thus estimating total tuition income from foreign fee-paying students is relatively straightforward. It was not always so.
In contrast, there is no official data on student spending on living costs. Our 2008 study (‘The Economic Impact of Export Education‘) was the first study in New Zealand that incorporated a dedicated and purposely designed survey of expenditure by foreign fee-paying students.
Collecting data on student spending might seem simple, but there are a number of obstacles to obtaining accurate data including:
Summing up expenditure on tuition fees and living costs gives the direct impact on the country’s gross domestic product. However, the net impact will be less than this as some of the foreign exchange earned by export education leaks out of the country as payment for imports of goods and services. Some imports such as petrol may be consumed directly by foreign students, while other imports are consumed indirectly. An example is clothing made from imported fabric.
Economic impact multipliers are used to estimate the direct and indirect consumption of imports of goods and services. Each dollar spent on the output of one industry leads to output increases in other industries, or to an increase in imports. For example for a university to deliver education services to a foreign student it requires inputs of books, energy, communication services and so on. Part of the tuition fee is used to cover the cost of these items. Another part covers the cost of the buildings and equipment (spread over their useful lives) and there is a large portion for staff wages and salaries.
The supplying industries such as energy require inputs themselves, pay wages and salaries, and so on. The effect on these supplying industries is known as the upstream or indirect production effect and is commonly measured by a number called a Type I multiplier. In essence the indirect upstream effects is just a representation of the process whereby the expenditure and income sides of the national accounts equilibrate. No additional value-added is created from this effect.
The supplying industries pay wages and salaries which are used to purchase household consumption goods, some of which are imported. This generates flow-on effects in an analogous manner to the original increase in export earnings and therefore generates an additional gain in gross domestic product. The effect is generally known as the downstream or induced consumption effect. Again the effect may be measured by a multiplier known as a Type II multiplier.
Multipliers are typically calculated for different measures of economic activity such as gross output, value-added and employment, but gross output multipliers lead to double counting. For example the value of food and drink supplied at a restaurant is counted as part of the gross output of both the Food and Beverage Manufacturing industry and the Restaurant industry. If one’s aim is to measure overall business activity this double counting may be useful, but from the perspective of economic contribution it is value-added or gross domestic product that is of interest.
While very useful, economic multipliers have limitations. For example they do not include the effects of increases in government consumption made possible by higher tax revenue, or the effects of changes in investment that may be required to expand output. It is also implicitly assumed that all factors of production are in excess supply and that that there are no price changes (such as if a factor is in limited supply) which may lead producers to change inputs, thereby altering their production structure and hence the associated economic multipliers.
All of these limitations have the potential to undermine the result of multiplier analysis – the wider the attempted coverage of indirect and induced effects, the greater is the potential for miscalculation and error. Rather like a stone thrown into a pond; the more the ripples spread out, the more likely they are to encounter some form of obstacle – ripples from another stone, a cross current, the embankment.
A superior, but more costly approach is to use a multi-industry general equilibrium model. These types of models incorporate all of the key inter-dependencies in the economy, such as flows of goods from one industry to another, plus the passing on of higher wage costs in one industry into prices and thence the costs of other industries.

Our estimates show that in 2008 the economic impact of New Zealand’s export education industry was $2.1 billion, implying a four-fold increase since 1999. Few industries would be able to claim an average growth rate of 16% pa for almost a decade.
Adolf Stroomberge


Source: Australian Government (2008) Review of Australian Higher Education: Final Report, December, Canberra: Commonwealth of Australia.
Australia is continuing to see rapid growth in the export of education (including higher education) services, and the associated generation of export income. Today’s Australian Education International‘s AEI eNewsletter, which is well worth subscribing to if you are interested in GlobalHigherEd (which you must be if you are visiting this weblog!), includes a link to a new Research Snapshot (November 2008) that notes:
International education activity contributed $14.2 billion in export income to the Australian economy in 2007-08, up 23.4 per cent from the previous financial year. Over the 10 years to 2007-08, education exports have grown at an average annual rate of 16 per cent, compared with an average annual rate of 7 per cent across all services exports.
Here is a copy of a relevant table from the new Research Snapshot:

This document updates some data we profiled in our 24 June 2008 entry titled ‘Analysing Australia’s global higher ed export industry‘.
The international comparability of export earnings data is something we intend on focusing on this year. If readers of GlobalHigherEd entry have insights on this topic, or would like to prepare a guest entry on it, please do not hesitate to contact us.
Kris Olds
This 11 October 2007 entry (‘Will shifting currency exchange rate differentials (2005-2007) redirect flows of foreign students?’) has always attracted a lot regular visits, perhaps from university students considering international options for their education, and from university and ministry officials.
In response to a reader’s request for an update, I got curious so quickly updated the currency exchange rate differential graph and have inserted it underneath the original, so you can see what has happened since 11 October.
I’ll place both graphs below too.

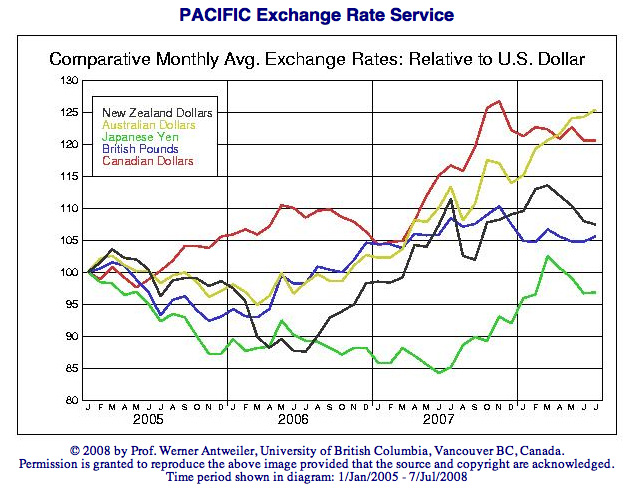
As you can see the most notable diverging currency in 2008, at least with respect to the US$, is the AUS$. Also see this recent entry (‘Analysing Australia’s global higher ed export industry’) for more information on the Australian scene.
I am curious how long the strong inflow numbers to Australia can continue given the rising strength of the AUS$ against that of the US, the world’s No. 1 foreign student destination, and location of most of the world’s highly ranked universities. But then again students and parents think about much more than exchange rates.
For example, the trends evident in ‘Analysing Australia’s global higher ed export industry’ should be related to these figures on tremendous increase in the number of Asian students, a social and demographic transition that Australia has managed to hook into, such that many students are angling for landed immigrant status above all. Thus, despite some critiques of the level of quality of higher education services on offer (partly spurred on by structural changes profiled in graphs like these), and the currency exchange rate differentials noted above, Australia’s export promotion machine appears to be chugging along.
Kris Olds

Source: Centre for International Economics (2008) APEC and International Education, Sydney and Canberra: Centre for International Economics.
The globalization of higher education and research is creating and attracting new players and new analysts. Credit ratings agencies have, for example, started to pay more attention to the fiscal health of universities, while fund managers are seeking to play a role in guiding the investment strategies of university endowments in the United States, and more recently Saudi Arabia.
On this broad theme, and further to our recent entry (‘New foreign student and export income geographies in the UK and Australia‘), the Reserve Bank of Australia released a June 2008 report titled ‘Australia’s Exports of Education Services‘. The Reserve Bank of Australia‘s:
main responsibility is monetary policy. Policy decisions are made by the Reserve Bank Board, with the objective of achieving low and stable inflation over the medium term. Other major roles are maintaining financial system stability and promoting the safety and efficiency of the payments system. The Bank is an active participant in financial markets, manages Australia’s foreign reserves, issues Australian currency notes and serves as banker to the Australian Government. The information provided by the Reserve Bank includes statistics – for example, on interest rates, exchange rates and money and credit growth – and a range of publications on its operations and research.
The scale and economic impact of this new industry is reflected in the Bank’s interest in the topic.
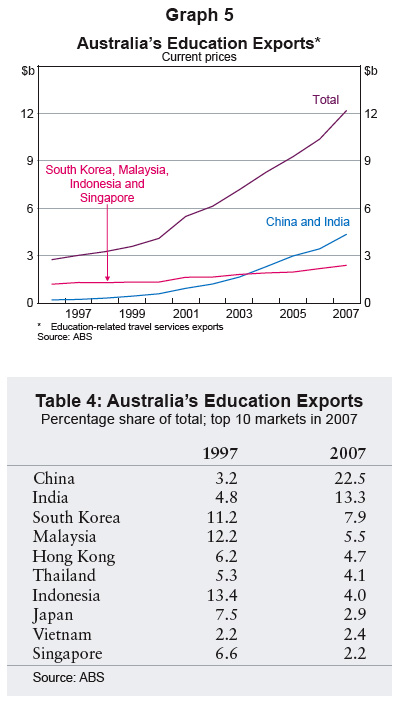
‘Australia’s Exports of Education Services‘ highlights key dimensions of the development of what is now one of Australia’s leading export industries such that it now generates $12.6 billion (2007 figures), and is Australia’s third largest export industry (see the two figures below from the report).

While the report is succinct, and can be downloaded for free here, I would like to flag three key themes from the perspective of the GlobalHigherEd analytical agenda.
First, reading through the report one cannot help but note the mercantilist approach that is infused in the analytical terms and data categories associated with the report, and Australian higher education ‘industry’ discussions more generally. From the dominant Australian perspective, global higher ed is unabashedly an export industry that needed to be created in a regulatory and ideological sense, and then subsequently, nurtured, reshaped over time, and more generally planned with strategic effect. Global higher ed is also situated within a broader array of educational services:
Data on international student enrollments (1994-2007) using these categories is also available at the Australian Education International website (see the site too for clarification about source data and a key methodological change in 2001).

This strategic cum assertive/aggressive approach to the creation of ‘customers’ means that Australia will also ensure it has a capacity to monitor its primary competitors (especially New Zealand, the United States and the UK), and its emerging competitors (especially the group of countries that make up the European Higher Education Area, as well as Malaysia, Singapore, and China). Competition can occur through enhanced capacity to attract the mobile students who should have come to Australia, enhanced capacity to keep them at ‘home’ (via “import-substitution” policies and programs), or the external profile of weaknesses in the quality of Australia’s higher educational offerings, especially for fee-paying foreign students.
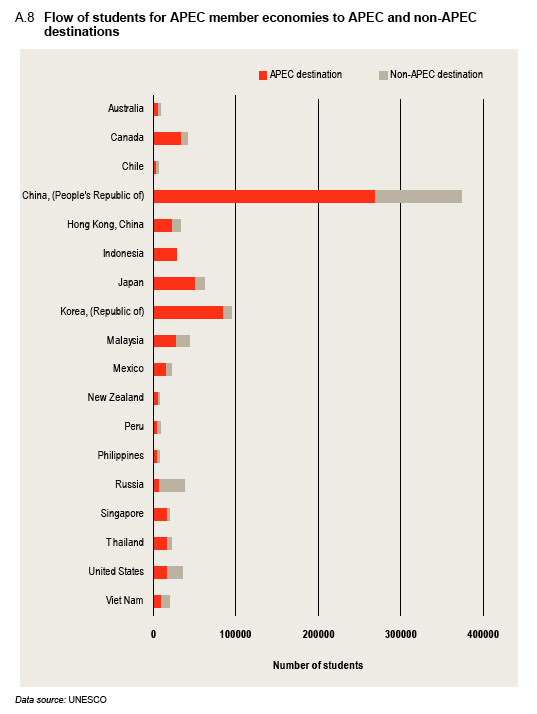
Second, the emergence of China and India as sources of mobile students is abundantly evident in the report (see Graph 5 and Table 4). Recall our 22 June entry, too, which presented data on Asian student numbers from the new Asian Development Bank (2008) report titled Education and Skills: Strategies for Accelerated Development in Asia and the Pacific. In short, Australia has strategically hooked into the highly uneven development wave evident in the ADB report, and shifted from ‘scholarship to dollarship’ (a phrase Katharyne Mitchell has used more generally) with respect to the country’s primary overseas student target. As the Bank’s report puts it:
Until the mid 1980s Australia’s involvement in providing education services to non-residents was directed by the Australian Government’s foreign aid program. Nearly all overseas students studying in Australia over this period were either fully or partly subsidised by the Australian Government, with the number of overseas students capped by an annual quota. Following reviews into Australia’s approach to the education of overseas students, including the 1984 Jackson Report, a new policy was released in 1985. This policy introduced a number of measures, such as allowing universities and other educational institutions to offer places to full fee-paying overseas students, which encouraged the development of Australia’s education exports sector. There were also changes in overseas student visa procedures aimed at helping educational institutions market their courses internationally. As a result of these changes, overseas student numbers increased significantly, and there has been a rise in the proportion of university funding sourced from fee-paying overseas students.

Third, the expansion of such a market, and the creation of significant export earnings, has created dependency upon full fee paying foreign students to bankroll a major component of the budgets of Australian universities (see Graph 4 above).
Thus, when between 15-20% of average annual revenue comes from “fee-paying foreign students”, especially the parents of Asian students, a condition of broad structural dependency exists, all ultimately shouldered upon household decision-making dynamics in places like Kuala Lumpur, Beijing, Mumbai, Seoul and Singapore. And it should also be noted that the income streams being generated from these students are proportionally being reinvested into the enhancement of the faculty base; indeed, as the figure below from a new Association of Universities and Colleges of Canada report (Trends in higher education – Volume 3: Finance) demonstrates, Australia has seen a massive increase in student numbers (local + foreign) but relatively little faculty growth.

Is it any wonder then, that the Brisbane Communiqué Initiative, an initiative that we will profile in early August, was developed in 2006, largely in response to the Bologna Process?
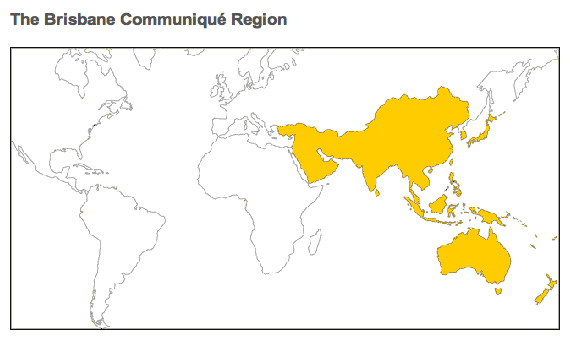
The Brisbane Communiqué, and related initiatives in Australia, remind us that structural dependency upon foreign (Asian) students exists. Given this, Australia cannot help but be concerned about any initiative that might lead to the possible realignment of Pacific Asian (especially China), and South Asian (especially India) higher education systems to the west (aka Europe), versus the south (Australia), when it comes to the mechanisms that enable international student mobility.
Kris Olds
I’ve been visiting the University of Warwick for the last two days and have noticed a serious level of international accent diversity at various campus sites, far more than was the case when I was a PhD student in Bristol in the mid-1990s. Not surprising, perhaps, given Warwick’s position as the third largest recipient of foreign students in the UK, as the Guardian coincidentally noted yesterday:
The universities with the largest numbers of international students.
2006-07 (latest figures)
1. Manchester University 8345
2. Nottingham University 7710
3. Warwick University 7435
4. Oxford University 6555
5. City University 6380
6. Cambridge University 6340
7. University College London 6135
8. London School of Economics 5980
9. Westminster University 5735
10. Birmingham University 5505Grand total of international students in all years (ie not just in their first year) at all universities in the UK and including undergraduates and postgraduates was 351,470
A related graphic on the regional “hotspots” in the Guardian is here. Recall that the UK is the second largest recipient of foreign students in the world.
Meanwhile in Australia, the 5th largest recipient of foreign students in the world, Australian Education International just released an interesting Research Snapshot (May 2008) that captures some of the economic effects of receiving foreign students [note: if you click on the table a clear full screen version will pop up]:
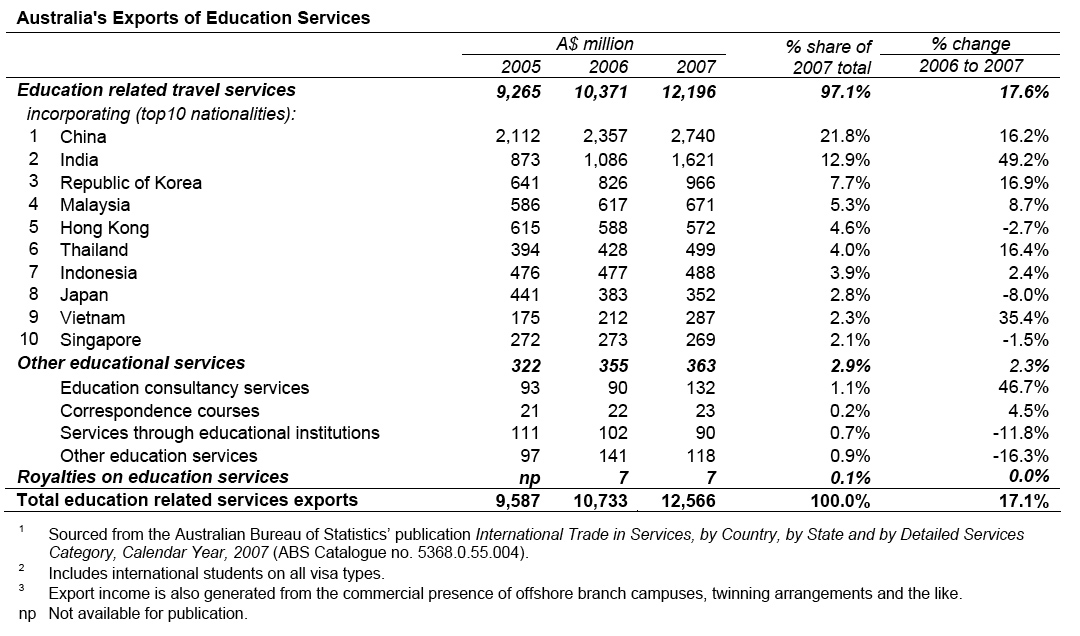
This is a significant economic impact. The same snapshot notes:
Of the total export income generated by education services in 2007, $12.2 billion was from spending on fees and goods and services by onshore students, and a further $370 million was from other education services such as offshore students’ fees and education consultancy services3. Education services remains Australia’s 3rd largest export, behind coal and iron ore ($20.8 billion and $16.1 billion respectively), and the largest services export industry ahead of personal travel (tourism) services ($11.8 billion).
This said, there is a distinctive geography to the impact:

Thus, while aggregate data tables (e.g., from the OECD’s valuable Education at a Glance 2007) are important to assess, there is huge institutional and geographic variation regarding the integration of foreign students into any one nation, highlighting, again, the importance of breaking free of methodological nationalism.
Kris Olds
